ENiGMA 1/2 Administration: Dealing with Logs
Logs Oh My!
An important part of any System Operator’s job is paying attention to the system’s logs. This can be reactionary when something doesn’t go as expected or the system just plain crashes, or perhaps passively observing.
ENiGMA 1/2 comes with a rich logging system backed by Bunyan, “a simple and fast JSON logging library”. Log entries are structured (JSON) and Newline Delimited. This makes for logs that are both easy to deal with programmatically (ie: for a machine) and for a human.
Levels
When first setting up a ENiGMA 1/2 system using oputil.js config new, you will be prompted for log level. This controls the verbosity of logging that the system will produce. Here is what each level means:
fatal: Something has gone horribly wrong and the system is going to stop or crash.error: Something has gone wrong that while it may not crash the system, a user could be kicked or data could be lost. This is also often used for invalid or missing configuration or files.warn: Non-fatal, but something you should pay attention to.info: Informational only.debug: Verbose output often useful for development.trace: The max logging level. Log everything we can!
See also Bunyan’s documentation on levels.
Setting your log level includes everything above it. For example, info includes warn, error, and fatal.
Configuration
Configuration related to logging is handled via the config.hjson file in the logging section. Here you can control things such as level, file names and paths, rotation, etc.
The default configuration looks like this:
1 | logging: { |
This above sets up the following:
A rotating log file called enigma-bbs.log (enigma-bbs.log.0 after one rotation, enigma-bbs.log.1 after the 2nd, then enigma-bbs.log.2). Logs are rotated daily (1d) and the level of debug.
The default path for logs is $enigma-bbs/logs. This can be changed in the paths section of the config.hjson file.
In general, anything configurable within Bunyan can be configured here.
Monitoring
A basic task is of course to monitor logs. This may be while you’re tweaking and modding your system, or just day to day monitoring. As an example, for Xibalba, I always have a terminal window open with a SSH session monitoring logs.
The easiest way to monitor logs is to “tail” them. On a *nix type system this literally uses the tail with the -F option to “follow”. Doing so this way will not result in interruptions as log file are rotated (On Windows with PowerShell this can be achieved with Get-Content enigma-bbs.log -Tail 10 -Wait). Let’s look at an example:
1 | ⋊> ~/xibalba on master ⨯ tail -F /home/enigma/xibalba/logs/enigma-bbs.log |
…yuk! Here we see the machine friendly JSON log entries. We’ll look at some things you can do with that later, but for now let’s turn this into something human friendly.
First step is to install Bunyan globally:
1 | # if using yarn |
This should install Bunyan and place it in our PATH. Now let’s try to tail again but this time pipe through Bunyan:
1 | ⋊> ~/xibalba on master ⨯ tail -F /home/enigma/xibalba/logs/enigma-bbs.log | bunyan |
This is much easier to deal with! You’re probably using a semi modern terminal though, which may look something more like this: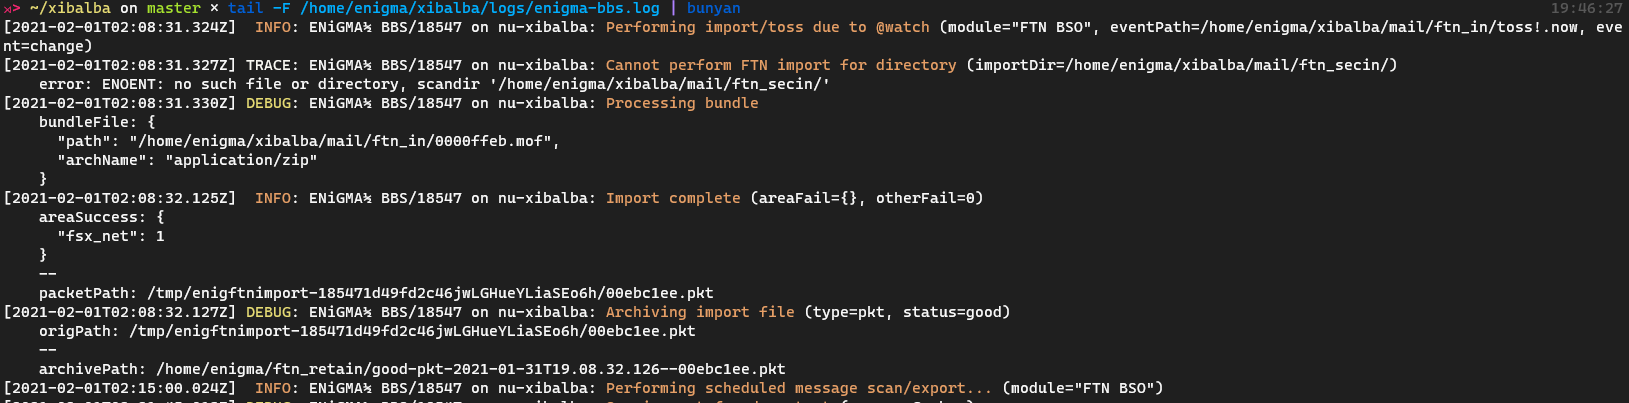
Data Extraction
As previously discussed, each log entry is a JSON object. This means we can use a number of tools to extract records. For example, suppose we want to see all the scheduled events that fired off yesterday. We can combine grep (I prefer ripgrep) and jq to get the job done. Here you can see these tools in action using jq to extract only the fields we’re interested in right now:
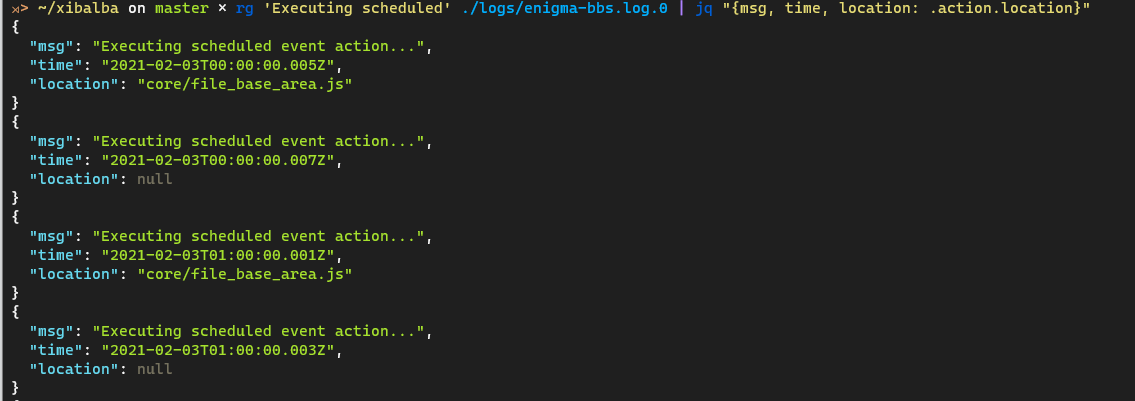
…and many more records…
Crash Logs
There are a number of ways to gather/inspect crash logs (that is: stack traces). If you’re running ENiGMA 1/2 directly via ./main.js a crash will be output to the screen. …but your system would not have restarted automatically and you have down time. One of the suggestions you’ll find in the docs is to run under pm2. If this is the case, you can see logs using the following command:
1 | pm2 logs |
There are many other supervisors you might be running under (systemd for example). Consult the particular documentation for more information.